Saturday, June 6, 2020

Beginner's guide to becoming a Data Engineer


Big Data Engineers: Myths vs. Realities | upGrad blog

1. Good Foundational Knowledge of SQL Programming (SQL Query writing)

Paid Course 

The best SQL course that I know. (I have not affiliation to the owner). I took this course it has been crucial to my success. It goes from beginner all the way to expert. It is not free. Cost $99

http://www.learnitfirst.com/Course/160/SQL-Queries-2008.aspx

Course Video hours: 50hrs
My estimated learning and absorption time: 1 to 3 months

Cheaper option

The Complete SQL Bootcamp 2020: Go from Zero to Hero in Udemy
This is a good first step to get you from beginner to intermediate
 

Cost 11 dollars

SQL - Beyond The Basics
This course focuses on advanced concepts that are crucial in getting through most interviews these days


Cost 11 dollars

Free SQL course alternatives

Beginner Crash course: https://www.youtube.com/watch?v=9Pzj7Aj25lw
Advanced and more comprehensive videos ;
https://youtu.be/HXV3zeQKqGY
https://youtu.be/2Fn0WAyZV0E

Course Video hours: 7 hrs
My estimated Time  to learn:  1 to 3 weeks

2. Knowledge of Python Programming Knowledge (only applies if you do not have any programming background)


1. Beginner / Basic Programming in Python:

I have not watched this but I skimmed through and it looks detailed for anyone brand new to programming or programming in python

2. Intermediate level: Python Data structures

This will go over a lot of the common data structures in python on when to use which and their common capabilities 

3. Intermediate level: Python Algorithms

This is helpful to go through various most common algorithms in interview questions using python.

4. Python for Data Analysis: Panda's Dataframe


Course Video hours:13 hrs 
My estimated Learning time: 1 month (A lot of time will be spent trying to practice)


3. Good understanding of ETL Computing Engine for Big Data- Spark/Databricks


1. Create a Databricks community edition account so you can have a platform to practice


2. Understand Spark architecture and the overall capabilities of Spark


3. Pyspark Tutorial- Knowledge of SQL and Python would really make learning Pyspark very easy


4. Databricks /Spark Optimization: this is important because a lot of interviews ask about this


Note that if you have good knowledge of SQL and Python you can work a lot with Spark

Total Course Hours: 12 hrs
My estimated Learning hours: 2 weeks


4. Cloud Knowledge AWS or AZURE; Get Certified if possible

Azure AZ-900: fundamental of Azure

AWS Solution Architect: Fundamentals of AWS

Pick one
Total Course Hours: 6-10 hrs
My estimated Learning Time: 1 week


5. Basics of Data Modelling: For Data engineers that need to work more with Business intelligence use cases 

Total Hours: 2 hrs
My estimated Learning hours : 5hrs


Summary

Getting into a Data Engineering career is not easy but I believe hard work and dedication can get you there. If you dedicate 3 months of the absolute focus of learning for 4 to 5 hrs a day or 30 hrs a week, you can master most of these fundamental skills and start getting entry-level jobs

I would spend 1 month in SQL,1 month in Python and last month in Spark, Cloud, and Data Modelling

There is a lot more to learn and I have another blog that listed comprehensively all the various tools and technologies a Data Engineer could have http://plsqlandssisheadaches.blogspot.com/2020/01/how-i-transitioned-to-data-engineer-as.html


Thursday, January 16, 2020

A Cost Effective Modern Data Analytics architecture. Go from Datalake file to PowerBI/Tableau using Databricks/Spark


This article describes one of the most cost-efficient and simple architectures that will satisfy business needs without data duplication

Business Case:
A common scenario in modern data warehousing/analytics is that certain Business units want to leverage data sitting on the data lake for their visualizations and analytics. They want to avoid pulling the data from the data lake into a local instance on Prem SQL Database. They have problems finding ways to connect their visualization tools directly to data stored in the Data lake. They also want to have a cloud-first approach that aligns with the companies initiative and goals. They want it cheap, and flexible.

Why is this cheap? You only pay for Databricks cluster On-time and DataLake file storage. Eliminate the need for any other tool like SQL Server, Azure SQL DataWarehouse, etc.

Example (Azure environment)
I have sales reports that were sent by a 3rd party to a file share. I want to process this data, combine it with some reference data from my product catalog system and visualize it in PowerBI or Tableau. So far, I am able to ingest the data with DataFactory, transform it with Databricks and store the transformed data into the Data Lake (Azure Data Lake Store Gen2). Now I want to create visualizations using this data with PowerBI or Tableau.

Challenge: PowerBI or Tableau does not support connectors to Azure Data Lake Store for various file types like parquet, orc. PowerBI can only connect to CSV files. This becomes a challenging scenario for a Data Analyst.
Old Solution: Push the data from Data Lake Store to SQL Server or using a different tool like Dremio to connect. These are not terrible solutions, however, they have disadvantages.


SOLUTION

Below is the high-level architecture


The above architecture describes how you can connect PowerBI directly to your Data lake by using Spark Connectors from Databricks.

In other to accomplish this, you have to create a Spark Database, and Tables in your Databricks cluster using the concept of the External table. 


For illustration, let's assume I have transformed and loaded my data in parquet file format to the Datalake (ADLS) using spark write dataframe API.

Now, I can use the below Spark SQL query to create an External table over this parquet file and this table schema and metadata information will be persisted in my cluster's default database, as long as the cluster is ON.

Query:
%sql
CREATE TABLE cleaned_taxes
  USING parquet
  LOCATION '/mnt/delta/cleaned_taxes'

In the above query sample. I am creating the external table over my 'cleaned_taxes' dataset. Please refer to this article for more details  https://docs.databricks.com/spark/latest/spark-sql/language-manual/create-table.html


Please note that this external table concept will work for any dataset that is supported by spark writer api (csv, orc, json, txt). Refer to this article for more detailshttps://jaceklaskowski.gitbooks.io/mastering-spark-sql/spark-sql-DataFrameWriter.html

You can confirm that the Spark table is created in your cluster  in the database section


Once this is done, you have readied your file (cleaned_taxes) for connection to a visualization tool using Spark Connector.

This next step is well documented in various blogs on how you can connect your PowerBI or Tableau to Databricks

For Tableau to Databricks see this link https://docs.databricks.com/bi/tableau.html

PowerBI to Databricks see this link  https://docs.microsoft.com/en-us/azure/databricks/bi/power-bi
or
 https://towardsdatascience.com/visualizing-data-with-azure-databricks-and-power-bi-desktop-845b0e317dc6

Things to Note
1. Your Databricks cluster has to be ON throughout this process to ensure connectivity from the Tableau or PowerBi.
2. Direct Query or Data Import modes are supported. I always prefer importing the data as long as it is able to fit into the Reporting server.
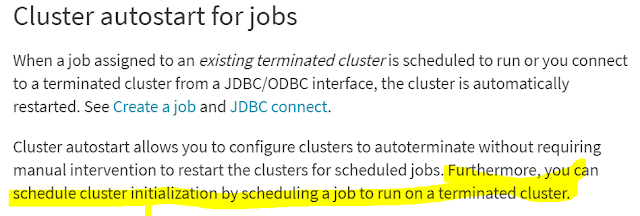
3. For  Dashboard or Report scheduled data refresh, you need the databricks cluster to be ON. This is accomplished by starting the cluster 10 mins before the Schedule report refresh time and giving it the required time (20mins to 1hr time) for a refresh. You can synchronize this by setting up a Databricks job on your cluster that runs before your reports refresh the data. The job could be a simple notebook that just waits for 30 mins and does nothing.


For additional information see article https://docs.databricks.com/clusters/clusters-manage.html

Example:

Create a notebook with the following python code that just waits for 60secs
import time
time.sleep6(60)   # Delays for 5 seconds. You can also use a float value.

Now create a job to fire this notebook 15 mins (Databricks cluster normally takes 5-10 mins to start) before your scheduled Report refresh time. This ensures the databricks cluster is warmed up and ready for JDBC calls from the dashboard report server

For more information on creating jobs in databricks see link https://docs.databricks.com/jobs.html#job-create


Disclaimer: This is just a conceptual illustration, not a demo with exact code. Please formulate your own logic and code

How to grow into a Data Engineer from an ETL, DBA, Analyst Background at no cost


This post is meant to highlight the core skills needed to be developed for anyone that is interested to be a data engineer. I have added some reference material that I actually used for my studies.

The below are ranked in terms of priority

1. Advanced SQL query knowledge
     https://youtu.be/HXV3zeQKqGY
    https://youtu.be/2Fn0WAyZV0E
2. Intermediate to Advanced understanding of Relational Databases
     https://youtu.be/ztHopE5Wnpc
3. Intermediate understanding of Data Modelling (Star Schema, Snowflake schema)
     https://youtu.be/tR_rOJPiEXc
     https://youtu.be/lWPiSZf7-uQ
4. Extract Transform Load basics
     https://youtu.be/7MOU1l30lXs
5. Data Warehousing
     https://youtu.be/lWPiSZf7-uQ
     https://youtu.be/CHYPF7jxlik

The above list most ETL, DBA or Business Analysts like me should have this already.

Additional Core Skills for Data Engineering (I had to learn these)
1. Deep understanding of the fundamental of any Big Data or Distributed Systems.
     https://youtu.be/tpspO9K28PM
     https://youtu.be/Y6Ev8GIlbxc
2. Apache Spark architecture and programming in Spark
     https://youtu.be/CF5Ewk0GxiQ
     https://youtu.be/GFC2gOL1p9k
     https://youtu.be/dq73Ghk3MQg
     Note: that the above videos might not be comprehensive feel free to go deeper. Also note that        RDD API is no more in common use, rather focus on Spark SQL, PYSpark or Scala API's
3. Python programming intermediate level
    https://youtu.be/rfscVS0vtbw
    https://youtu.be/mkv5mxYu0Wk   (Python for Datascience, )
    https://youtu.be/vmEHCJofslg (learn Pandas library)
    https://www.youtube.com/watch?v=K8L6KVGG-7o
4. Cloud computing basics (Azure, AWS) fundamentals
     https://www.youtube.com/playlist?list=PL-V4YVm6AmwWLTTwZdI7hcpKqTpFUIKUE (Azure)
5. Hadoop Distributed Files System Architecture
     https://youtu.be/pY0Wgbe712o
   
6. Big Data File Formats
     https://youtu.be/UXhyENkYokw
     https://youtu.be/rVC9F1y38oU
7. Hive
    https://youtu.be/AcpGl0TQIRM 
8. Optimization Techniques for all the above systems or topics

Additional Skills that are also needed but not a priority
1. Kafka and streaming tools like (Spark Streaming)
2. NO SQL Databases
3. Continuous Integration and Continuous Development coding method
4. Data Lake basics
5. Cloud ETL tools
6. Graph Databases
7. Machine Learning
8. Microservices
     https://youtu.be/j1gU2oGFayY
9. Map Reduce
10. Unix file system scripts basics
11. Regex

Wednesday, January 15, 2020

Common Data Engineer Interview Questions

Azure cloud

1. What is the difference between Azure Data Lake Gen 1 and Gen 2"
2. Types of roles in DataFactory and their differences?
3. What is needed in Datafactory to copy data from On premise Database to Azure storage (ADLS)
3. What are the Integration runtime details and the types?
4. How and different ways to connect to Azure Data Lake to Databricks?

Distributed Systems Open Source

    Spark
      1. Explain your understanding of Spark architecture?
      2. What are Broadcast and Accumulator variables?
      3. Difference between Spark cluster mode and Client mode?
      4. Difference between Checkpoint and Cache
      5. Types of Caching in Spark, Cache vs Persist?
      6. Types of transformations in Spark
      7. What are Spark Jobs, Stages, Tasks and their differences?
      8. What defines the number of stages that can be created in a spark job?
      9. What is Delta Lake?
      10. What is Vaccum in Delta lake and time travel?
      11. Spark optimization techniques for large table joins and skewed data?
      12. Explain spark partitioning or how is parallelism achieved in spark?
       13.  How does spark ensure fault tolerance
        14.    Bucketing in spark, Partition pruning,
        15.   What is spark lazy execution


     Hive
      1. What is H Catalog in Hive?


      File Formats
       1. Advantages of parquet files
       2. Types of parquet files


Tuesday, January 14, 2020

Handling PowerBI csv parsing for fields with double quotes (")

We have a requirement to create PowerBI Dashboards from Azure Data Lake Store (ADLS Gen2) csv files.

However, when importing data in PowerBI some columns were misaligned because PowerBI was parsing double-quote characters are field delimiters inappropriately.


Solution

In your ETL replace all double quote characters to two single quote characters.

Sunday, November 3, 2019

How to capture Azure Data Factory Copy Activity Log details


In this blog post I will show you how to implement your own custom logging in Azure Data Factory

Before you do this please note that Azure has its own in built Log analytics where it stores these logs and gives you multiple options to distribute and share it.

https://docs.microsoft.com/en-us/azure/data-factory/monitor-using-azure-monitor


Scenario: We had a requirement to capture our ETL process in log files. In our process we were copying data from on prem data sources like SQL Server and Oracle Databases to Azure Data Lake Store Gen2. Then in Data lake store we had multiple stages from Raw folder layer, Refined folder layer and Produce layer, we would be applying various transformations from one layer to the next using Databricks notebook.

The requirement was to track the record counts from Source system all the way to the Produced layer (visualization layer). Since we wanted to have detail of our ETL in one file we decided to build our own custom logging framework


FRAMEWORK ARCHITECTURE


1. Use new copy Activity to read the output of the Actual Copy Activity then write the results to a Azure Data Lake Store file as csv
2. Pass the RunID details from the ADF job to a Databricks notebook and use that to create the dataframe of record counts from each layer.
3. Combine the two log files ( ADF log file and databricks log file) into one master file for the entire ETL process in Databricks


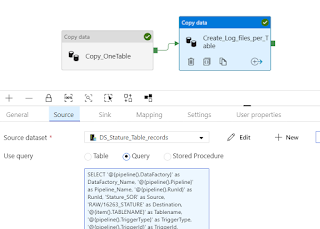
CAPTURING LOGS OF ADF COPY ACTIVITY USING A NEW COPY ACTIVITY(SOURCE AS SQL SERVER AND SINK AS ADLS)

Below is a sample copy activity output


The query used to extract the copy logs is below. Using a SQL Server Linked service the query below ran to pull both system variable and copy activity output variable. Notice the different ways to access the nested json values


SELECT '@{pipeline().DataFactory}' as DataFactory_Name,
'@{pipeline().Pipeline}' as Pipeline_Name,
'@{pipeline().RunId}' as RunId,
'Stature_SOR' as Source,
'RAW/16263_STATURE' as Destination,
'@{item().TABLENAME}' as Tablename,
'@{pipeline().TriggerType}' as TriggerType,
'@{pipeline().TriggerId}' as TriggerId,
'@{pipeline().TriggerName}' as TriggerName,
'@{pipeline().TriggerTime}' as TriggerTime,
'@{activity('Copy_OneTable').output.rowsCopied}' as rowsCopied,
'@{activity('Copy_OneTable').output.rowsRead}' as RowsRead,
'@{activity('Copy_OneTable').output.usedParallelCopies}' as No_ParallelCopies,
'@{activity('Copy_OneTable').output.copyDuration}' as copyDuration_in_secs,
'@{activity('Copy_OneTable').output.effectiveIntegrationRuntime}' as effectiveIntegrationRuntime,
'@{activity('Copy_OneTable').output.executionDetails[0].source.type}' as Source_Type,
'@{activity('Copy_OneTable').output.executionDetails[0].sink.type}' as Sink_Type,
'@{activity('Copy_OneTable').output.executionDetails[0].status}' as Execution_Status,
'@{activity('Copy_OneTable').output.executionDetails[0].start}' as CopyActivity_Start_Time,
'@{utcnow()}' as CopyActivity_End_Time,
'@{activity('Copy_OneTable').output.executionDetails[0].detailedDurations.queuingDuration}' as CopyActivity_queuingDuration_in_secs,
'@{activity('Copy_OneTable').output.executionDetails[0].detailedDurations.timeToFirstByte}' as CopyActivity_timeToFirstByte_in_secs,
'@{activity('Copy_OneTable').output.executionDetails[0].detailedDurations.transferDuration}' as CopyActivity_transferDuration_in_secs


After writing this details to a csv file in ADLS. We created a notebook that passes in the runid as the input parameter to continue our custom logging

Tuesday, January 8, 2019

Performing SCD type 2 in Hive without using Merge statement


Introduction


Are you scratching your head trying to do a Merge statement in Hive? You know this is not the optimal way to use Hive yet you want to get the work done. Today is your lucky day.


I work for a company that unfortunately picked the wrong tool for routine analytics. Currently we use Hadoop Hive for our day to day Business Intelligence analytics requirements. We actually don't have more than 2 million rows of data across all our projects. Talk about under utilization.


One of the most recent request was to implement a type 2 slowly changing dimension (SCD) for a project that needed a historical trail. For a brief review of SCD can be found in Wikipedia here


Procedure


In this specific project, every day I extract records from an Oracle OLTP (online) database and store it into a Staging table. Then this Staging data is "Merged" into a Target table. By "Merge" I mean inserting new records and updating the "Valid to date" of the existing record


In most relational database we have an Update clause that can be used effectively to implement SCD 2. This helps us compare and combine two tables normally a stage and target table for example when matched


In this implementation of SCD type 2, we are creating 4 metadata columns to help us keep track of the records


  1. UDC_Valid_FROM_DT : This field is used to store the date the ETL “last saw” the record from the source system. It denotes that the version of the record for that day the ETL was run. This date will help tell the story of the various version of a specific record (per business key). By default every new extraction from source will have a value of system date
  2. UDC_Valid_TO_DT: This field is used to denote the “end” life span/ expiration date of a record (per business key). This will be used to show when a specific version of a record ceased to be valid or exist in the source system. By default every new extracted record from source will have a value ‘9999-12-31’, denoting a future date or infinity since that is the latest version of the record according to the source system
  3. UDC_IsCurrent: This field is another way to represent the Valid_to_DT of ‘9999-12-31’ but it’s main purpose is to easily display which version of a record(per business key) is the latest according to the source system. By default, every new extract each day will have a value of ”1”. “0” will mean that the record is no longer the most up to date version of that record.
  4. UDC_IsActive: This field is used to denote records(per business key) that are still existing in the source. It is not used to denote the most current version but rather to show that the business key could still be found in the source system since we know the source deletes records. By default, this field will be “1” for each extracted record. It will be “0” whenever the ETL notices that the business key does not exist in the source system


To implement this I created a staging table where I truncate and load the source extracted data into on a daily basis.


For the Target table we normally perform a Merge statement after the very first historical load.
The MERGE STATEMENT in any relational database to implement a SCD II is a routine and powerful SQL statement. However, in Hive we are limited to basic SQL statements.


In this blog, I will show you how I implemented this Merge statement in HIVE


Since my version of Hive does not even have an UPDATE functionality, I use the "CREATE table as" statement to recreate a new version of the table


NOTE: In this SCD II implementation we are only keeping the history when there is a change in certain key column (key_col)  we care about or want to track from the source system.
pk_col means primary key column


select
t.col_1,t.key_col,t.pk_col,
t.udc_Valid_from_DT, case when t.udc_valid_to_DT ='9999-12-31' and s.pk_col is  null and s1.pk_col is not null
THEN Date_add(from_unixtime(unix_timestamp()),0)
ELSE t.udc_valid_to_DT END AS udc_valid_to_DT
,case when t.udc_valid_to_DT ='9999-12-31' and s.pk_col is  null and s1.pk_col is not null THEN 0
ELSE t.udc_iscurrent END as udc_iscurrent,
case when s1.pk_col is null then 0 Else 1 end udc_isactive
from target_table T
left join  Source_stage_table S on T.pk_col = S.pk_col and T.key_col =s.key_col
left join  Source_stage_table S1 on T.pk_col = S1.pk_col
union all
select
s.col_1
,s.key_col
,s.pk_col,
,TO_CHAR(SYSDATE, 'YYYY-MM-DD') udc_valid_from_dt,
'9999-12-31' udc_valid_TO_dt,
1 UDC_Iscurrent, 1 UDC_IsActive
from Source_stage_table s
where not exists (select 1 from target_table t where T.pk_col  = S.pk_col  and T.key_col =s.key_col
)


BECOME A BIG DATA ENGINEER IN 3 MONTHS with less than $100 investment

INTRO: Below is my guide to becoming a data engineer based on the current job market (08/08/2020) demands. I have outlined the TOP 5 foun...