This article describes one of the most cost-efficient and simple architectures that will satisfy business needs without data duplication
Business Case:
A common scenario in modern data warehousing/analytics is that certain Business units want to leverage data sitting on the data lake for their visualizations and analytics. They want to avoid pulling the data from the data lake into a local instance on Prem SQL Database. They have problems finding ways to connect their visualization tools directly to data stored in the Data lake. They also want to have a cloud-first approach that aligns with the companies initiative and goals. They want it cheap, and flexible.
Why is this cheap? You only pay for Databricks cluster On-time and DataLake file storage. Eliminate the need for any other tool like SQL Server, Azure SQL DataWarehouse, etc.
Example (Azure environment)
I have sales reports that were sent by a 3rd party to a file share. I want to process this data, combine it with some reference data from my product catalog system and visualize it in PowerBI or Tableau. So far, I am able to ingest the data with DataFactory, transform it with Databricks and store the transformed data into the Data Lake (Azure Data Lake Store Gen2). Now I want to create visualizations using this data with PowerBI or Tableau.
Challenge: PowerBI or Tableau does not support connectors to Azure Data Lake Store for various file types like parquet, orc. PowerBI can only connect to CSV files. This becomes a challenging scenario for a Data Analyst.
Old Solution: Push the data from Data Lake Store to SQL Server or using a different tool like Dremio to connect. These are not terrible solutions, however, they have disadvantages.
SOLUTION
Below is the high-level architecture
Reference: https://docs.microsoft.com/en-us/azure/architecture/solution-ideas/articles/modern-data-warehouse
The above architecture describes how you can connect PowerBI directly to your Data lake by using Spark Connectors from Databricks.
In other to accomplish this, you have to create a Spark Database, and Tables in your Databricks cluster using the concept of the External table.
Now, I can use the below Spark SQL query to create an External table over this parquet file and this table schema and metadata information will be persisted in my cluster's default database, as long as the cluster is ON.
Query:
%sql
CREATE TABLE cleaned_taxes
  USING parquet
  LOCATION '/mnt/delta/cleaned_taxes'
In the above query sample. I am creating the external table over my 'cleaned_taxes' dataset. Please refer to this article for more details https://docs.databricks.com/spark/latest/spark-sql/language-manual/create-table.html
Please note that this external table concept will work for any dataset that is supported by spark writer api (csv, orc, json, txt). Refer to this article for more detailshttps://jaceklaskowski.gitbooks.io/mastering-spark-sql/spark-sql-DataFrameWriter.html
You can confirm that the Spark table is created in your cluster in the database section
Once this is done, you have readied your file (cleaned_taxes) for connection to a visualization tool using Spark Connector.
This next step is well documented in various blogs on how you can connect your PowerBI or Tableau to Databricks
For Tableau to Databricks see this link https://docs.databricks.com/bi/tableau.html
PowerBI to Databricks see this link https://docs.microsoft.com/en-us/azure/databricks/bi/power-bi
or
https://towardsdatascience.com/visualizing-data-with-azure-databricks-and-power-bi-desktop-845b0e317dc6
Things to Note
1. Your Databricks cluster has to be ON throughout this process to ensure connectivity from the Tableau or PowerBi.
2. Direct Query or Data Import modes are supported. I always prefer importing the data as long as it is able to fit into the Reporting server.
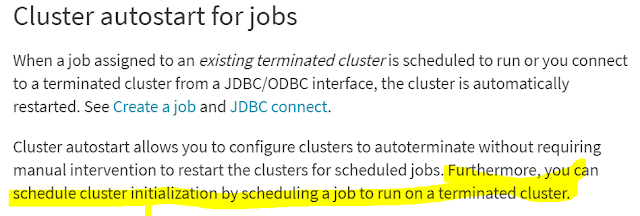
3. For Dashboard or Report scheduled data refresh, you need the databricks cluster to be ON. This is accomplished by starting the cluster 10 mins before the Schedule report refresh time and giving it the required time (20mins to 1hr time) for a refresh. You can synchronize this by setting up a Databricks job on your cluster that runs before your reports refresh the data. The job could be a simple notebook that just waits for 30 mins and does nothing.
For additional information see article https://docs.databricks.com/clusters/clusters-manage.html
Example:
Create a notebook with the following python code that just waits for 60secs
import time
time.sleep6(60) # Delays for 5 seconds. You can also use a float value.Now create a job to fire this notebook 15 mins (Databricks cluster normally takes 5-10 mins to start) before your scheduled Report refresh time. This ensures the databricks cluster is warmed up and ready for JDBC calls from the dashboard report server
For more information on creating jobs in databricks see link https://docs.databricks.com/jobs.html#job-create
Disclaimer: This is just a conceptual illustration, not a demo with exact code. Please formulate your own logic and code


Thank you for sharing this Informative blog, it is very useful.
ReplyDeleteData Engineering Services
Great article, thank you for sharing.
ReplyDeleteData Engineering Training And Placement